

.png)
Zeelo
Thank you! Your submission has been received!
Oops! Something went wrong while submitting the form.
Solutions

Technology
Resources
Zeelo
Introducing Customer Reporting in the Zeelo Customer Portal
Our new reporting insights gives customers self-service access to dashboards, program performance metrics, and operational transport data.

.avif)

Our new reporting insights for customers, giving key contacts direct access to program performance data anytime they need it.
With these new reporting dashboards, teams can quickly explore key operational metrics, review recent performance, and monitor daily trip activity in a self service dashboard. This makes it easier for customers to understand how their transport programs are performing and turn those insights into action.
From reactive to strategic: why reporting matters
Most transport programs don’t start with clear visibility.
They begin in a reactive state. Teams respond to issues as they arise, rely on manual reports, and spend time chasing information instead of acting on it.
As programs grow, so does the need for better oversight. That’s where data becomes critical.
By making performance data accessible, consistent, and easy to explore, teams can shift from reacting to problems to actively improving their transport programs.
Customer Reporting Insights is designed to give customers this visibility.
See the data behind your transport program
Understanding how your transport service is performing is the first step toward improving it. With Customer Reporting Insights in the Zeelo Customer Portal, teams can quickly see what’s working, identify opportunities to optimize routes, and make informed decisions about their transport programs.
If you’d like to learn more about how Zeelo can support your organization’s transport strategy, we’d be happy to help, get in touch with us today!
What’s included in Customer Reporting Insights
To support this shift toward more proactive and strategic transport management, we’ve introduced a set of dashboards directly within the Customer Portal.
These dashboards give teams immediate access to performance data, without relying on scheduled reports or manual requests.
The main reporting dashboard includes two key views that provide both high-level trends and detailed operational insights.
Overall program performance
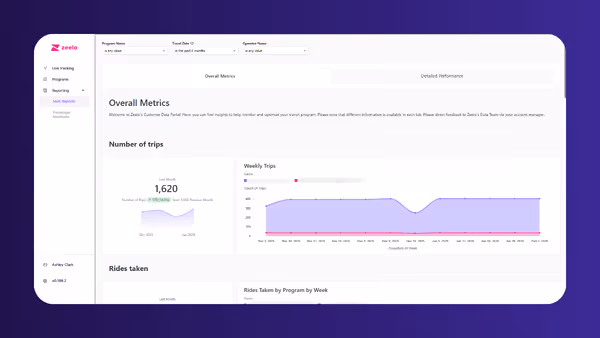
The Overall Metrics dashboard shows how your transport program is performing over time.
Here you’ll find core metrics such as:
- Number of trips
- Total rides taken
- Occupancy trends
- On-time performance
- Rider feedback scores
- Environmental impact metrics, including cars removed from the road and CO₂ emissions saved
This view makes it easy to monitor performance month-to-month and identify long-term trends across routes or programs.
For organizations managing multiple routes or locations, these insights help highlight where services are performing well and where adjustments may be needed.
Detailed performance insights
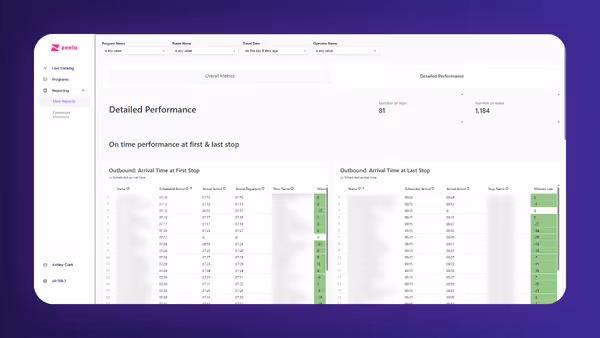
The Detailed Performance dashboard focuses on recent activity and operational performance.
This includes:
- Scheduled vs actual arrival times at stops
- Trip performance data
- Rider feedback results
- Booked vs boarded rider data
- Occupancy trends
This view helps teams understand how services are running day to day and quickly spot any operational issues or patterns.
Passenger manifests and operational visibility
In addition to the core reporting dashboards, the portal also supports passenger manifest dashboards, available upon request.
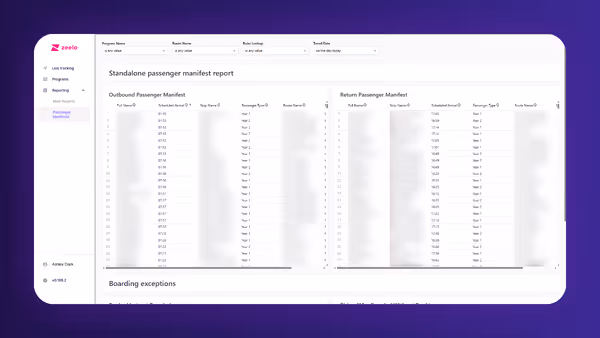
These dashboards provide a detailed look at the riders on each trip, including:
- Rider names
- Scheduled arrival times
- Stop locations
- Route names
- Boarding status
- Boarding exceptions such as riders who boarded without booking or were booked but did not board
Key report features and functionality
Flexible filtering and deeper analysis
Each dashboard includes filters at the top of the page so users can explore data in more detail.
Customers can filter by:
- Program
- Route
- Stop type
- Date or date range
These filters make it easy to focus on a specific service, location, or time period.
For example, teams might review a single route’s performance, compare different programs, or analyze performance trends over a specific timeframe.
Exporting and sharing reports
The reporting experience also makes it simple to share insights with others in your organization.
Customers can:
- Download individual charts or entire dashboards
- Export data in formats such as CSV, Excel, PDF, or PNG
- Schedule reports to be emailed automatically to stakeholders
For many customers, this removes the need to request reports manually and allows teams to respond to internal questions faster.
Supporting smarter transport decisions
Customer Reporting Insights is part of a broader effort to help customers better understand and continuously improve their transport programs.
As teams gain more visibility into performance, they’re able to move beyond day-to-day operations and start making more strategic decisions about how their services are designed and delivered.
In This Article:
ABOUT ZEELO
We help companies and schools achieve their transportation program goals
COMMUTERS
Corporate shuttles

Retain employees, increase happiness

COMMUTERS
Warehouse/Distribution
Attract employees, increase productivity

EDUCATION
Schools & Universities

Save 20% on running costs & deliver a 100% safe school transportation program

OPERATORS
Become a partner
Increase revenue and access contracts in your area

Want to know how we can help you?
Get in touch for a free consultation to see how zeelo could help your business.

More articles like this one

Trusted. Every trip.
Zeelo is the smart bus platform for organizations. We design, manage and optimize transport programs to help our clients achieve their goals.